
Dimension Reduction Correlation & Low Variance Filter
What is dimensionality reduction? The name might sound fancier than what it actually is. It is simply the process of reducing the number of dimensions in a dataset aka reducing the number of attributes/features/columns while retaining key information in the dataset.

Wait, but why?
- Because more data does not necessarily mean we get better model performance. Many attributes could be noise to the key signals in a dataset (overfitting, curse of dimensionality).
- Data compression to reduce storage size, which reduces computational resource and helps speed up algorithm.
- Reducing data to 2D or 3D allows us to visualize the data.
There are two approaches to dimensionality reduction comprising different techniques/algorithms:
- Feature Selection – selecting subset of feature in the dataset without transforming the dataset as a whole
- Feature Extraction – transforming the dataset into a lower dimensional space
For part 1 of dimensionality reduction, we’ll get started with applying three simple feature selection techniques using Python.
import pandas as pd
import numpy as np
To explore how to apply different dimension reduction techniques in Python, I will use a data set on food nutrient facts from Kaggle as an example. This data set has 134754 rows and 161 columns. One row per food product.
https://www.kaggle.com/openfoodfacts/world-food-facts
food_data = pd.read_csv('openfoodfacts.tsv', sep='\t')
food_data.shape
(134754, 161)
food_data.columns
Index([u'code', u'url', u'creator', u'created_t', u'created_datetime',
       u'last_modified_t', u'last_modified_datetime', u'product_name',
       u'generic_name', u'quantity',
        ...
       u'ph_100g', u'fruits-vegetables-nuts_100g',
       u'collagen-meat-protein-ratio_100g', u'cocoa_100g', u'chlorophyl_100g',
       u'carbon-footprint_100g', u'nutrition-score-fr_100g',
       u'nutrition-score-uk_100g', u'glycemic-index_100g',
       u'water-hardness_100g'],
       dtype='object', length=161)
food_data.head(4)
| code | url | creator | created_t | created_datetime | last_modified_t | last_modified_datetime | product_name | generic_name | quantity | ... | ph_100g | fruits-vegetables-nuts_100g | collagen-meat-protein-ratio_100g | cocoa_100g | chlorophyl_100g | carbon-footprint_100g | nutrition-score-fr_100g | nutrition-score-uk_100g | glycemic-index_100g | water-hardness_100g | |
|---|---|---|---|---|---|---|---|---|---|---|---|---|---|---|---|---|---|---|---|---|---|
| 0 | 3087 | http://world-en.openfoodfacts.org/product/0000... | openfoodfacts-contributors | 1474103866 | 2016-09-17T09:17:46Z | 1474103893 | 2016-09-17T09:18:13Z | Farine de blé noir | NaN | 1kg | ... | NaN | NaN | NaN | NaN | NaN | NaN | NaN | NaN | NaN | NaN |
| 1 | 24600 | http://world-en.openfoodfacts.org/product/0000... | date-limite-app | 1434530704 | 2015-06-17T08:45:04Z | 1434535914 | 2015-06-17T10:11:54Z | Filet de bœuf | NaN | 2.46 kg | ... | NaN | NaN | NaN | NaN | NaN | NaN | NaN | NaN | NaN | NaN |
| 2 | 27083 | http://world-en.openfoodfacts.org/product/0000... | canieatthis-app | 1472223782 | 2016-08-26T15:03:02Z | 1472223782 | 2016-08-26T15:03:02Z | Marks % Spencer 2 Blueberry Muffins | NaN | 230g | ... | NaN | NaN | NaN | NaN | NaN | NaN | NaN | NaN | NaN | NaN |
| 3 | 27205 | http://world-en.openfoodfacts.org/product/0000... | tacinte | 1458238630 | 2016-03-17T18:17:10Z | 1458238638 | 2016-03-17T18:17:18Z | NaN | NaN | NaN | ... | NaN | NaN | NaN | NaN | NaN | NaN | NaN | NaN | NaN | NaN |
4 rows × 161 columns
food_data.isnull().sum()
code                                    23
url                                     23
creator                                  2
created_t                                4
created_datetime                        10
last_modified_t                          0
last_modified_datetime                   0
product_name                         18578
generic_name                         84411
quantity                             35948
packaging                            59313
packaging_tags                       59311
brands                               27194
brands_tags                          27200
categories                           56286
categories_tags                      56307
categories_en                        56286
origins                             113257
origins_tags                        113294
manufacturing_places                100295
manufacturing_places_tags           100301
labels                               93449
labels_tags                          93363
labels_en                            93342
emb_codes                           106460
emb_codes_tags                      106463
first_packaging_code_geo            116621
cities                              134732
cities_tags                         115136
purchase_places                      79454
                                     ...
biotin_100g                         134437
pantothenic-acid_100g               134074
silica_100g                         134717
bicarbonate_100g                    134676
potassium_100g                      134058
chloride_100g                       134601
calcium_100g                        130445
phosphorus_100g                     133870
iron_100g                           132149
magnesium_100g                      133475
zinc_100g                           134271
copper_100g                         134598
manganese_100g                      134609
fluoride_100g                       134676
selenium_100g                       134575
chromium_100g                       134735
molybdenum_100g                     134744
iodine_100g                         134499
caffeine_100g                       134705
taurine_100g                        134720
ph_100g                             134706
fruits-vegetables-nuts_100g         133091
collagen-meat-protein-ratio_100g    134591
cocoa_100g                          133904
chlorophyl_100g                     134754
carbon-footprint_100g               134489
nutrition-score-fr_100g              67502
nutrition-score-uk_100g              67502
glycemic-index_100g                 134754
water-hardness_100g                 134754
dtype: int64
Missing Value Ratio
Attributes with a lot of missing values are not providing a lot of information. We can either impute the values for these attributes or remove from dataset. We compute the % of missing values and determine whether to drop the attribute or not. The threshold is up to you but roughly speaking an attribute with ~40-50% missing values could be dropped.
We can leverage isnull function from pandas dataframe to count how many empty fields are in each column. We can also leverage this information to calculate the % of missing values for each attribute.
missing = food_data.isnull().sum()
pct_missing = 1.0*missing/len(food_data)
print pct_missing.sort_values(ascending=False)
water-hardness_100g                      1.000000
-nervonic-acid_100g                      1.000000
no_nutriments                            1.000000
ingredients_from_palm_oil                1.000000
ingredients_that_may_be_from_palm_oil    1.000000
nutrition_grade_uk                       1.000000
-butyric-acid_100g                       1.000000
-caproic-acid_100g                       1.000000
-lignoceric-acid_100g                    1.000000
-cerotic-acid_100g                       1.000000
glycemic-index_100g                      1.000000
-elaidic-acid_100g                       1.000000
-mead-acid_100g                          1.000000
-erucic-acid_100g                        1.000000
-melissic-acid_100g                      1.000000
chlorophyl_100g                          1.000000
-myristic-acid_100g                      0.999993
-caprylic-acid_100g                      0.999993
-montanic-acid_100g                      0.999993
-stearic-acid_100g                       0.999993
-palmitic-acid_100g                      0.999993
-capric-acid_100g                        0.999985
-lauric-acid_100g                        0.999970
-maltose_100g                            0.999970
nucleotides_100g                         0.999948
-arachidonic-acid_100g                   0.999941
molybdenum_100g                          0.999926
-maltodextrins_100g                      0.999918
-oleic-acid_100g                         0.999911
serum-proteins_100g                      0.999896
                                           ...
proteins_100g                            0.445916
energy_100g                              0.440907
packaging                                0.440158
packaging_tags                           0.440143
image_url                                0.434577
image_small_url                          0.434577
main_category                            0.418021
main_category_en                         0.418021
categories_tags                          0.417850
categories                               0.417694
categories_en                            0.417694
pnns_groups_1                            0.372085
pnns_groups_2                            0.351440
quantity                                 0.266768
brands_tags                              0.201849
brands                                   0.201805
product_name                             0.137866
countries_tags                           0.002070
countries                                0.002070
countries_en                             0.002070
states_en                                0.000341
states_tags                              0.000341
states                                   0.000341
url                                      0.000171
code                                     0.000171
created_datetime                         0.000074
created_t                                0.000030
creator                                  0.000015
last_modified_datetime                   0.000000
last_modified_t                          0.000000
dtype: float64
It is evident there are significant number of attributes that barely have any information. Lets remove features that have less than 25% value.
new_food_data = food_data[pct_missing[pct_missing < 0.75].index.tolist()]
new_food_data.columns
Index([u'code', u'url', u'creator', u'created_t', u'created_datetime',
       u'last_modified_t', u'last_modified_datetime', u'product_name',
       u'generic_name', u'quantity', u'packaging', u'packaging_tags',
       u'brands', u'brands_tags', u'categories', u'categories_tags',
       u'categories_en', u'manufacturing_places', u'manufacturing_places_tags',
       u'labels', u'labels_tags', u'labels_en', u'purchase_places', u'stores',
       u'countries', u'countries_tags', u'countries_en', u'ingredients_text',
       u'serving_size', u'additives_n', u'additives', u'additives_tags',
       u'additives_en', u'ingredients_from_palm_oil_n',
       u'ingredients_that_may_be_from_palm_oil_n', u'nutrition_grade_fr',
       u'pnns_groups_1', u'pnns_groups_2', u'states', u'states_tags',
       u'states_en', u'main_category', u'main_category_en', u'image_url',
       u'image_small_url', u'energy_100g', u'fat_100g', u'saturated-fat_100g',
       u'carbohydrates_100g', u'sugars_100g', u'fiber_100g', u'proteins_100g',
       u'salt_100g', u'sodium_100g', u'nutrition-score-fr_100g',
       u'nutrition-score-uk_100g'],
      dtype='object')
Low Variance Filter
Attributes with very little change in its data, e.g. all values are 1s, also provides very little information. Similar to Missing Value Ratio, we remove attributes based on a define threshold of variance. Variance is range dependent therefore normalization is required and only applicable to numerical attributes.
We need to normalize each dimension as variance is range dependent. We can use the MinMaxScaler function from sklearn preprocessing module to normalize value in each dimension to a value between 0 and 1. The challenge with this is that sklearn estimators does not handle NaN or missing values. An intermediate step is required to infer missing data with either mean or median or whatever statistics that would make most sense. There are different ways to do this like using fillna() function in pandas or Imputer module from sklearn.
Another method we can simple define our own normalization function.
from sklearn import preprocessing
var_fil_food_data = new_food_data.copy()
scaler = preprocessing.MinMaxScaler()
#Extract numeric columns because cannot normalize and compute variance on categorical
numeric_columns = var_fil_food_data.dtypes[var_fil_food_data.dtypes == 'float64'].index
for i in numeric_columns:
    var_fil_food_data[i].fillna(value=var_fil_food_data[i].mean(), inplace=True) #replace NaN with mean of dimension
    var_fil_food_data[i] = scaler.fit_transform(var_fil_food_data[i].values.reshape(-1,1))
    #Normalize. if we don't use .values.reshapes it still works but sklearn throws depracated warning
var_fil_food_data[numeric_columns].mean()
additives_n                                0.054490
ingredients_from_palm_oil_n                0.031198
ingredients_that_may_be_from_palm_oil_n    0.020675
energy_100g                                0.012728
fat_100g                                   0.133428
saturated-fat_100g                         0.054690
carbohydrates_100g                         0.072374
sugars_100g                                0.130803
fiber_100g                                 0.027809
proteins_100g                              0.075218
salt_100g                                  0.001004
sodium_100g                                0.001005
nutrition-score-fr_100g                    0.427915
nutrition-score-uk_100g                    0.457145
dtype: float64
var_fil_food_data[numeric_columns].var()
additives_n                                0.003423
ingredients_from_palm_oil_n                0.008250
ingredients_that_may_be_from_palm_oil_n    0.002640
energy_100g                                0.000061
fat_100g                                   0.014988
saturated-fat_100g                         0.003620
carbohydrates_100g                         0.002530
sugars_100g                                0.017339
fiber_100g                                 0.000658
proteins_100g                              0.003247
salt_100g                                  0.000020
sodium_100g                                0.000020
nutrition-score-fr_100g                    0.013776
nutrition-score-uk_100g                    0.017170
dtype: float64
Looking at the mean and variance, we could explore removing energy_100g, salt_100g sodium_100g.
new_food_data = new_food_data.drop(['energy_100g', 'salt_100g', 'sodium_100g'], axis=1)
Correlation Filter
Attributes that are highly correlated tends to carry similar information, e.g. a company’s overall spend and its marketing spend. Because highly correlated attributes contain similar information, we can keep just one of these attributes.
To keep this example simple, we will only look at the correlation between numeric variables. For categorical variables, there is an additional encoding step (covered in another blog article) that is required, which simply splits every categorical value of one dimension into individual columns with binary values of 1 or 0.
We can build a correlation matrix using the corr function in pandas. We could also use a more visual approach by using heatmap from seaborn library.
corr_fil_food_data = new_food_data.copy()
#Extract numeric columns because cannot normalize and compute variance on categorical
numeric_columns = corr_fil_food_data.dtypes[corr_fil_food_data.dtypes == 'float64'].index
corr_fil_food_data = corr_fil_food_data[numeric_columns]
corr_fil_food_data.corr()
| additives_n | ingredients_from_palm_oil_n | ingredients_that_may_be_from_palm_oil_n | fat_100g | saturated-fat_100g | carbohydrates_100g | sugars_100g | fiber_100g | proteins_100g | nutrition-score-fr_100g | nutrition-score-uk_100g | |
|---|---|---|---|---|---|---|---|---|---|---|---|
| additives_n | 1.000000 | 0.247840 | 0.433042 | -0.027467 | -0.019006 | 0.119767 | 0.124980 | -0.107708 | -0.083062 | 0.202419 | 0.187053 |
| ingredients_from_palm_oil_n | 0.247840 | 1.000000 | 0.179777 | 0.108486 | 0.142192 | 0.211748 | 0.168584 | 0.011094 | -0.036060 | 0.245711 | 0.248023 |
| ingredients_that_may_be_from_palm_oil_n | 0.433042 | 0.179777 | 1.000000 | 0.042765 | 0.044454 | 0.122512 | 0.052955 | -0.038976 | -0.058680 | 0.121939 | 0.125042 |
| fat_100g | -0.027467 | 0.108486 | 0.042765 | 1.000000 | 0.735497 | -0.071676 | 0.023426 | 0.082148 | 0.146350 | 0.591396 | 0.655143 |
| saturated-fat_100g | -0.019006 | 0.142192 | 0.044454 | 0.735497 | 1.000000 | -0.012336 | 0.121237 | 0.020530 | 0.131305 | 0.623594 | 0.664247 |
| carbohydrates_100g | 0.119767 | 0.211748 | 0.122512 | -0.071676 | -0.012336 | 1.000000 | 0.637138 | 0.246810 | -0.103593 | 0.257640 | 0.248387 |
| sugars_100g | 0.124980 | 0.168584 | 0.052955 | 0.023426 | 0.121237 | 0.637138 | 1.000000 | 0.034637 | -0.237634 | 0.480360 | 0.448149 |
| fiber_100g | -0.107708 | 0.011094 | -0.038976 | 0.082148 | 0.020530 | 0.246810 | 0.034637 | 1.000000 | 0.230218 | -0.102295 | -0.092460 |
| proteins_100g | -0.083062 | -0.036060 | -0.058680 | 0.146350 | 0.131305 | -0.103593 | -0.237634 | 0.230218 | 1.000000 | 0.094913 | 0.156746 |
| nutrition-score-fr_100g | 0.202419 | 0.245711 | 0.121939 | 0.591396 | 0.623594 | 0.257640 | 0.480360 | -0.102295 | 0.094913 | 1.000000 | 0.967227 |
| nutrition-score-uk_100g | 0.187053 | 0.248023 | 0.125042 | 0.655143 | 0.664247 | 0.248387 | 0.448149 | -0.092460 | 0.156746 | 0.967227 | 1.000000 |
import seaborn as sns
import matplotlib.pyplot as plt
%matplotlib inline
sns.set()
fig, ax = plt.subplots()
fig.set_size_inches(15, 15)
sns.heatmap(corr_fil_food_data.corr(), annot=True, )
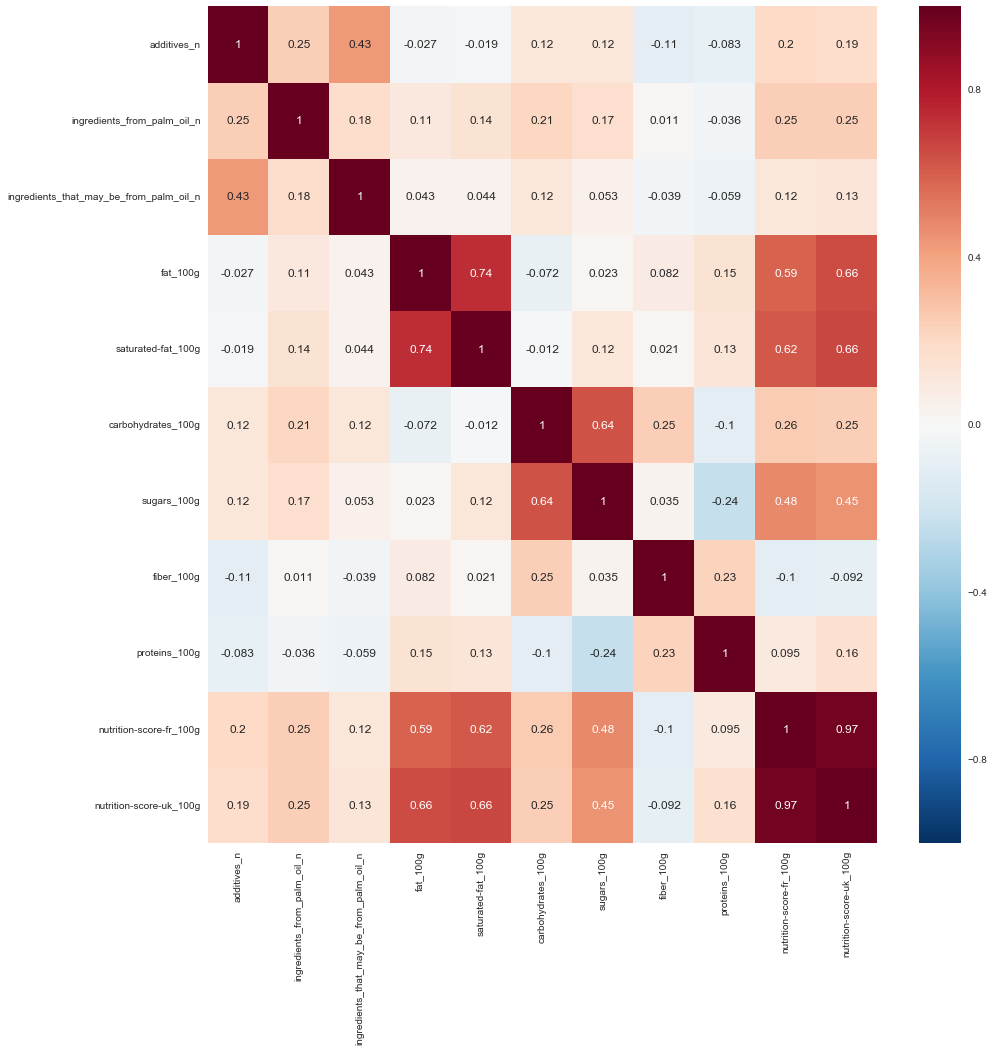
It is evident that:
- nutrition-score-fr_100g is highly correlated with nutrition-score-uk_100g
- fat_100g is pretty correlated with saturated-fat_100g
- nutrition-score-uk_100g is pretty correlated with fat_100g and saturated-fat_100g
- nutrition-score-fr_100g is pretty correlated with fat_100g and saturated-fat_100g
- sugars_100g is pretty correlated with carbohydrate_100g
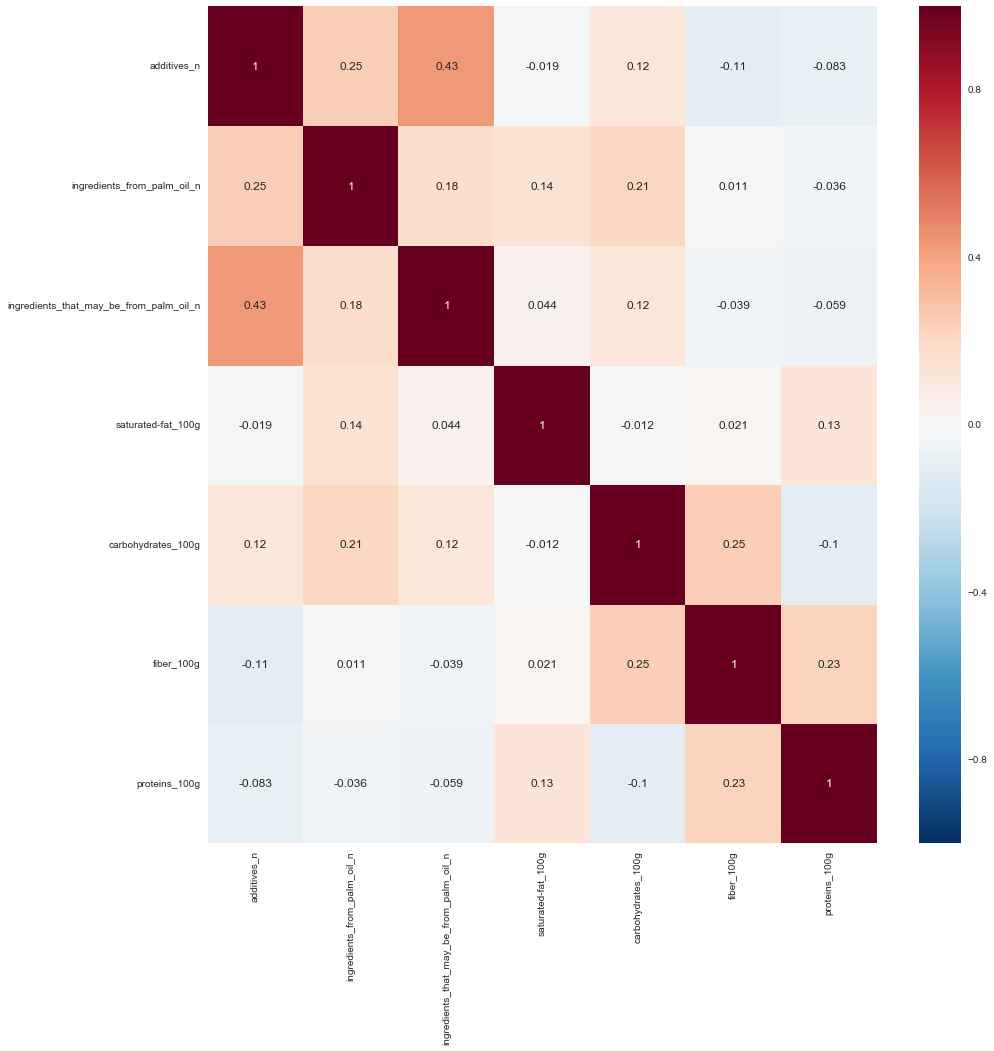
Lets remove one of these attributes
fig, ax = plt.subplots()
fig.set_size_inches(15, 15)
sns.heatmap(corr_fil_food_data.drop(
        ['nutrition-score-fr_100g',
         'nutrition-score-uk_100g',
         'fat_100g', 'sugars_100g'],
        axis=1).corr(), annot=True, )
Result
Using these three simple techniques for dimension reduction, we’ve reduce this dataset from 161 variables down to 49. Do keep in mind that the goal of dimension reduction is to remove attributes that are not very informative. More data does not necessarily mean better and at the same time less data does not necessarily mean better as well. The art is to find a set of attributes within a high dimension data set that will provide sufficient information.
new_food_data.shape
(134754, 49)